
A unified
scientific workspace.
Flux is a suite of software tools designed from the start for science — figures, presentations, literature, and papers, all connected in one place.
With built-in tools to connect the AI agent of your choice.
macOS and Linux · Open source, MIT license · Python plotting with fluxplot
 View
workspace
View
workspace
How it fits together
One project. Every part stays connected.
Plots made with fluxplot keep a name on every part. Figures are composed from those plots, papers and slides are built from those figures, and references flow in from your library. One document, one deck: export them to whatever format the journal, the conference or your co-author needs.
- Plain files. Manuscripts are Quarto Markdown, references are BibTeX, figures and decks are readable JSON beside their SVGs. Keep the folder in git, open it in any editor, hand it to a colleague.
- Live links. A plot placed in a figure stays linked to its source. Re-run the analysis and the regenerated plot hot-swaps into every figure, with your restyles intact.
- Write once, export anywhere. A journal style is applied on the way out, never to your text, so switching from one journal to another or from PDF to Word is a menu choice.
Semantic plots
A plot is a structure, not a picture.
Every meaningful part of a fluxplot plot carries a stable name. Hover the plot: a single point, the median line, the tick labels of an axis. That name is what you restyle in Figure, caption in Paper and animate in Slides, and it survives when the plot is regenerated.

Move the pointer over the plot, or choose a part from the list. Every element you land on has a stable name. Click a part to keep it selected.
A real plot saved by fluxplot, inspected on this page. The names come from the plot’s own manifest, exactly as Flux reads them. Values are synthetic.
Made in Flux
Publication figures, composed in an editor made for science.
Two figures from a demonstration project. Every panel is a named plot or model that can be opened, restyled and regenerated.

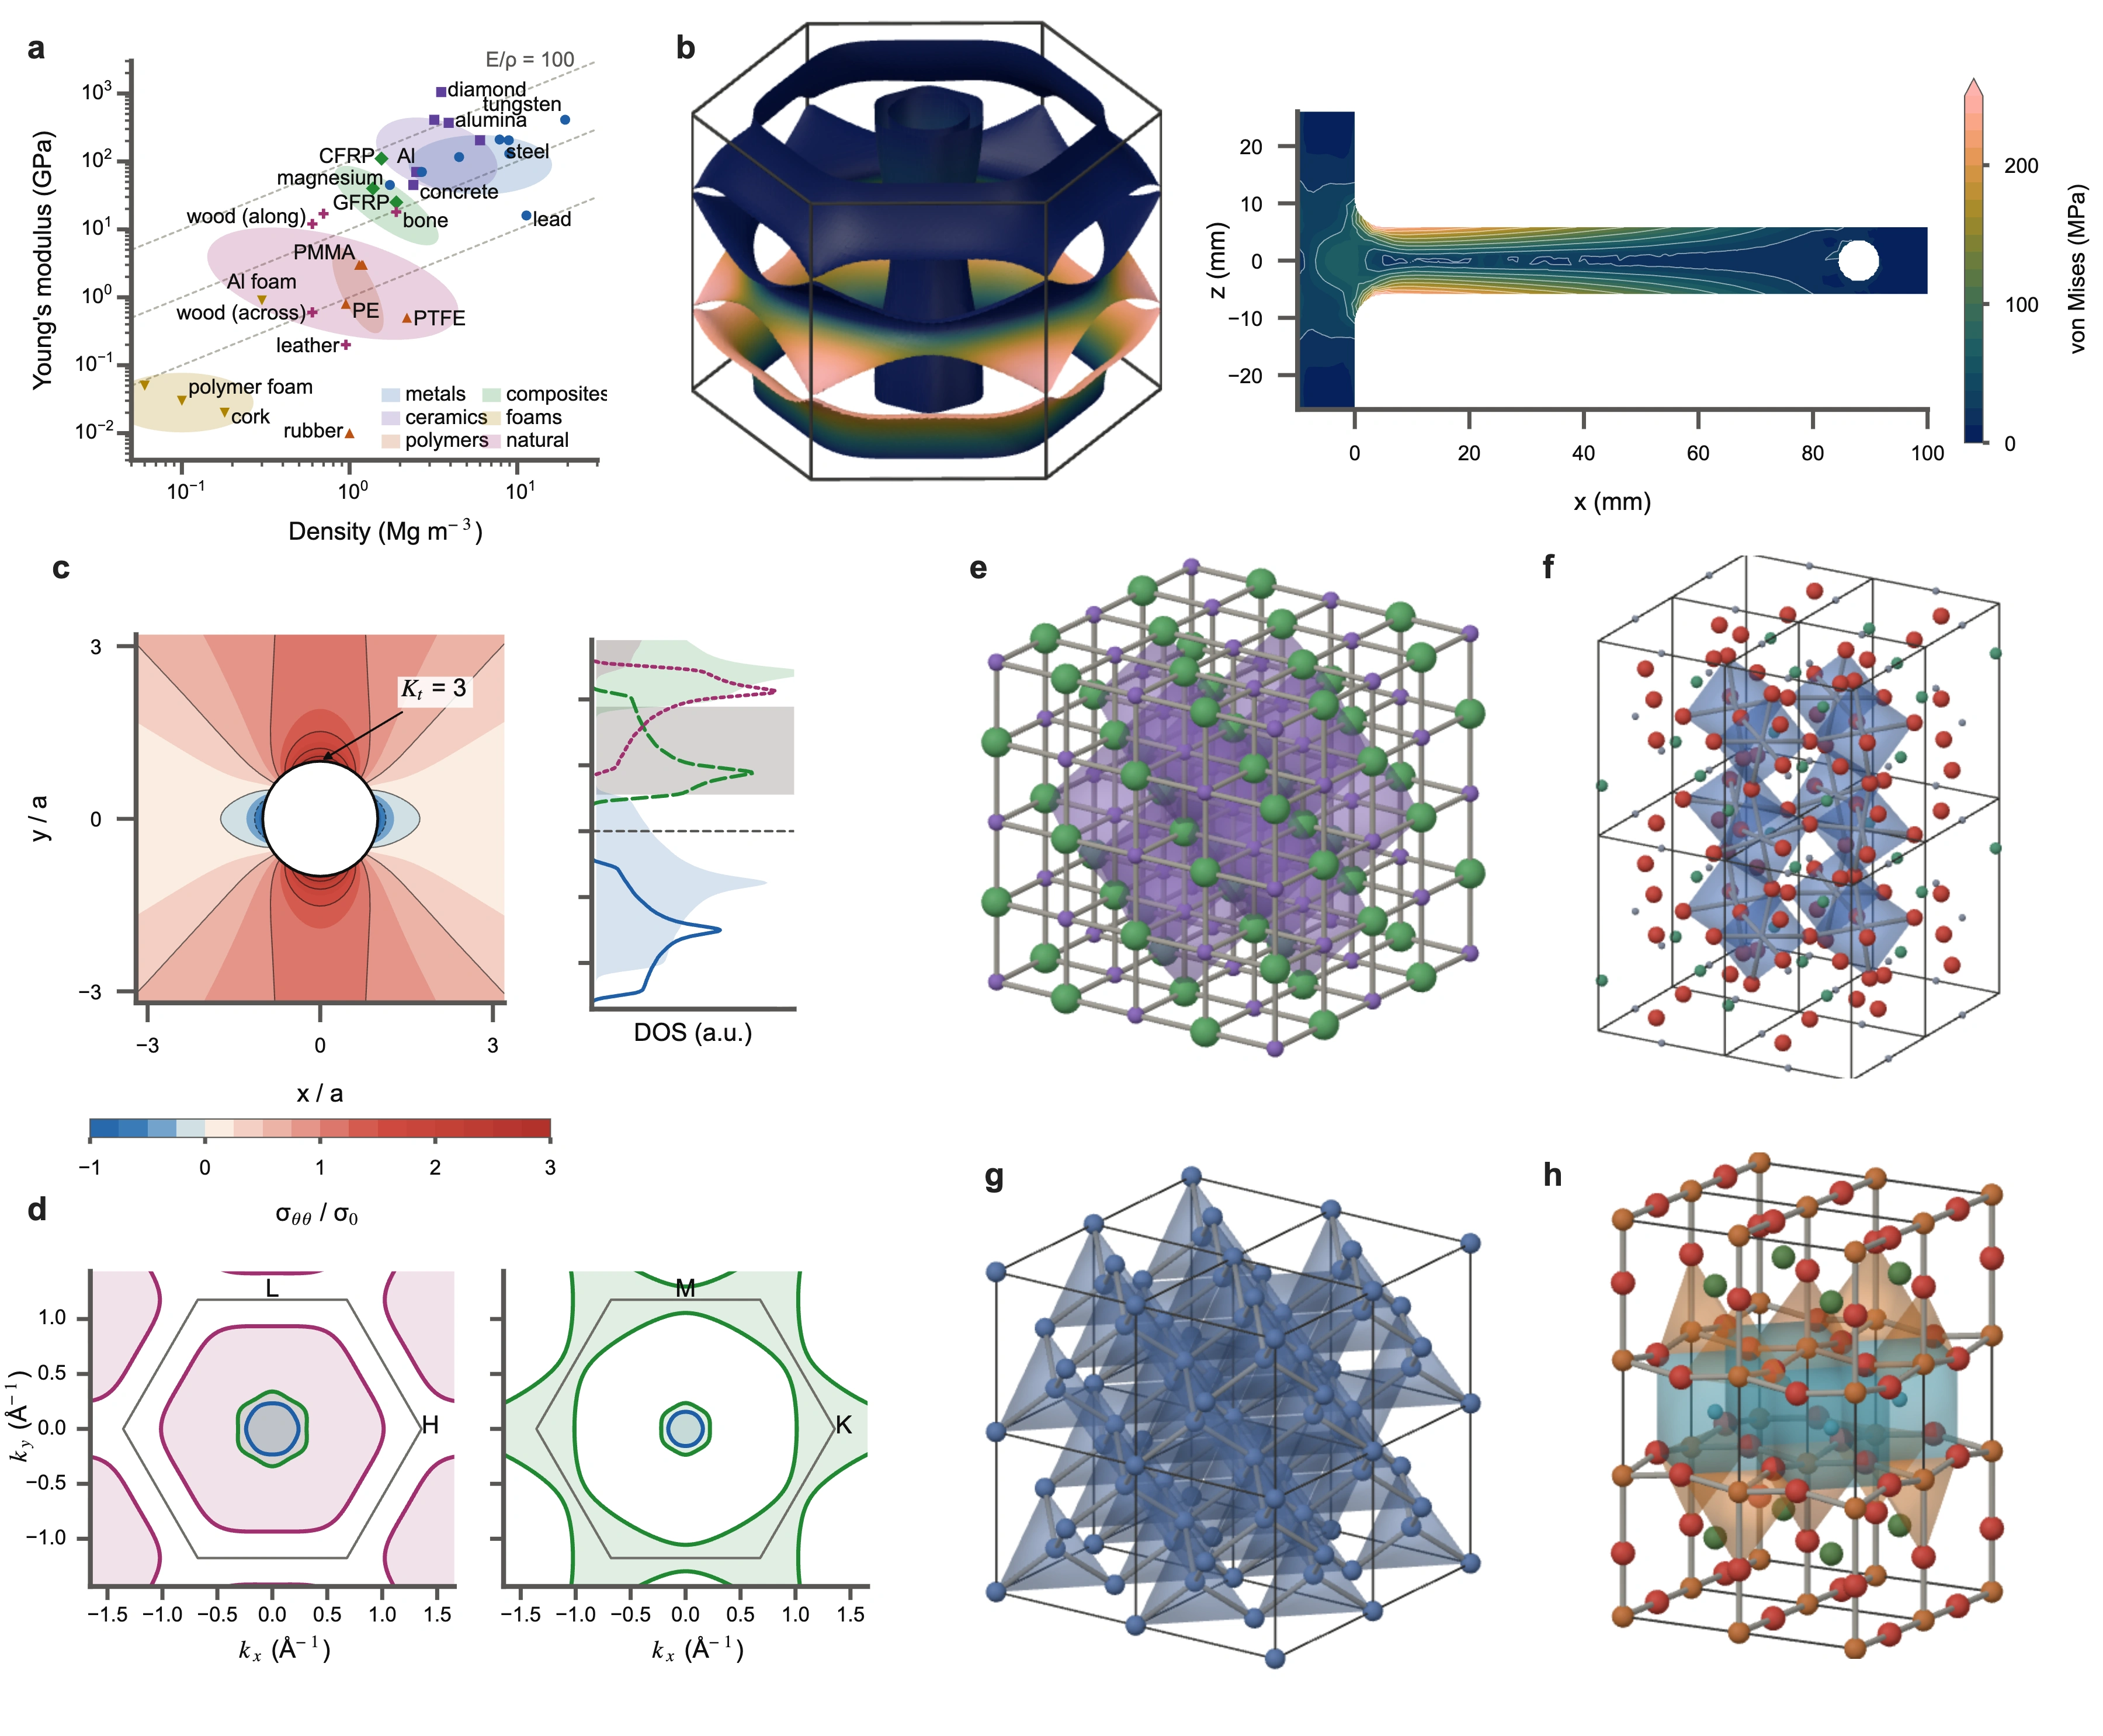
Neuroscience data and anatomy: Allen Institute for Brain Science and MICrONS. Materials: COD, FermiSurfer and calculated examples. Sources and captions →
Slides
Explain it in motion.
In Flux, any figure can become a slide, because the underlying editor and files are the same. That makes it seamless and simple to take a figure you have already made and add motion: turn one chart into the statistic it explains, send a figure’s parts into a new plot, morph one 3D shape into the next. Every change is a step you trigger, and the deck exports as one self-contained HTML file.
Pick a slide above, then use the arrows to step through it. The player is Flux’s own.
Learn about SlidesData: PDB 1CRN, GEO GSE52778 and NHANES. Anatomy: Allen CCF2017, with illustrative latencies. Visual credits.

Your research.
In Flux.
One command installs the app on macOS or Debian and Ubuntu Linux.
curl -fsSL https://fluxsci.org/install.sh | bashFree and open source · Apple Silicon and Intel Macs · x86-64 Debian and Ubuntu